nadia-quant
Overview
Perform reads alignment, gene expression quantification and barcode filtering.
nadia-quant takes sequencing reads (after quality control by
nadia-reads) and index folder (generated by nadia-ref) and performs
reads alignment, gene expression quantification and barcode filtering. There are
two pipelines: STARsolo and Alevin-fry. nadia-quant support
both single-cell and single-nucleus workflow. It also have several
options to filter barcodes, such as –top-cells, –expect-cells,
–emptydrops-cr, –knee. Finally, it also create knee plot, violin plot,
and highest expressed gene plot for quality control purposes.
How it works
1. STARsolo pipeline
STAR is a splice aware aligner, which is usually used to align RNA-seq reads to
reference genome. STARsolo is a comprehensive turnkey solution for quantifying
gene expression in single-cell/nucleus RNA-seq data, built into STAR. To use
STARsolo pipeline, use --aligner starsolo option. This pipeline requires
a STAR index folder, which could be generated by nadia-ref.
2. Alevin-fry pipeline
Alevin-fry is a suite of tools for the rapid, accurate and memory-frugal processing single-cell and single-nucleus sequencing data.
To use alevin-fry pipeline, use --aligner alevin-fry option. It requires
salmon index folder, transcript to gene file, and gene_id_to_name.tsv file.
They can all be generated by nadia-ref (see Output). If
salmon index folder is created by nadia-ref, users do not need to
manually specify the two later files by –t2g and –id2name argument.
The first step of the pipeline is generating a RAD file using salmon alevin.
There are two strategies for mapping reads against the transcriptiome:
selective-alignment
and pseudoalignment. Users can
select the mapping strategy by --mode pseudo or --mode selective option.
Next, the following tools will be run:
alevin-fry generate-permit-list: determine a set of cells that were likely present in our sample.alevin-fry collate: collate the original RAD filealevin-fry quant: quantify the collated RAD filealevinQC: collect QC metricspyroe.load_fry: processing alevin-fry quantification result
See: Alevin-fry docs and Pyroe docs
3. Barcode structures
Because nadiatools is developed to comparable with data generated from Nadia instrument, some barcode structures of read 1 was built in. Users can choose barcode structure by -s, –structure option.
RNAdia
Use for RNAdia reagent kit 1.0 and 2.0.
Expected structures of Read 1 (28 bases):
WSJJJJJJJJJJJJNNNNNNNNNNNNNV

# W= A or T; S= G or C; J=12 bases cell barcode; N / V = 14 degenerate bases (UMI)
# WS bases should NOT be analysed and are NOT part of the barcode!
Drop-Seq
Use for Drop-Seq data.
Expected structures of Read 1 (20 bases):
JJJJJJJJJJJJNNNNNNNN

# J=12 bases cell barcode; N = 8 bases UMI
4. Barcode filtering
There are 4 options to filter barcodes:
Top cells
Syntax: --top-cells <TOP_CELLS>
Sort the barcodes in the descending order of count (UMI/reads) and keep the
first <TOP_CELLS> barcodes.
This option corresponds to:
--soloCellFilter TopCells <TOP_CELLS>in STARsolo.--force-cells <TOP_CELLS>in Alevin-fry.
Expected cells
Syntax: --expect-cells <EXPECT_CELLS>
Cell calling method in Cell Ranger 2.2. Use the expected number of cells as a hint to estimate a robust cutoff around this value.
This option corresponds to:
--soloCellFilter CellRanger2.2 <EXPECT_CELLS> 0.99 10in STARsolo.--expect-cells <EXPECT_CELLS>in Alevin-fry.
EmptyDrop CellRanger
Syntax: --emptydrops-cr <nExpectedCells> <umiMin> <FDR>
EmptyDrops implementation from Cell Ranger. Only available for starsolo pipeline.
This option accept 3 parameters: <nExpectedCells> <umiMin> <FDR>. If none of them are specified, then use the default values: nExpectedCells=3000, umiMin=500, FDR=0.01.
Knee distance
Syntax: --knee
Only available for Alevin-fry pipeline. It is the method that is used in the whitelist command of UMI-tools to attempt to automatically determine the number of true barcodes
5. Mixed human and mouse experiments
If the sample is a mixture of human cells and mouse cells (e.g. HEK and 3T3), you can use –mixed-species flag to produce extra graphs. The purpose is to access the doublet rate.
Briefly, we calculate the proportion of UMIs derived from human genes and mouse genes for each barcode. If the proportion of human UMI is greater than the threshold (–ratio), then that barcode is considered to contain human cells, otherwise it contains mouse cells.
We then create the Doublet rate plot and Barnyard plot.
Input
Sequence reads in FASTQ format
Index folder
Output
Matrix
Matrix (raw and filtered) in mtx format in MTX folder.
AnnData object in h5ad format in anndata folder.
Note
With STARsolo pipeline, two matrix will be output (raw and filter). Raw
matrix is created without cell filtering step.
Report
nadia-quant produces a multiqc report in html format. You can download an
example report
QC plots
nadia-quant produces some QC plots, which appear in multiqc report.
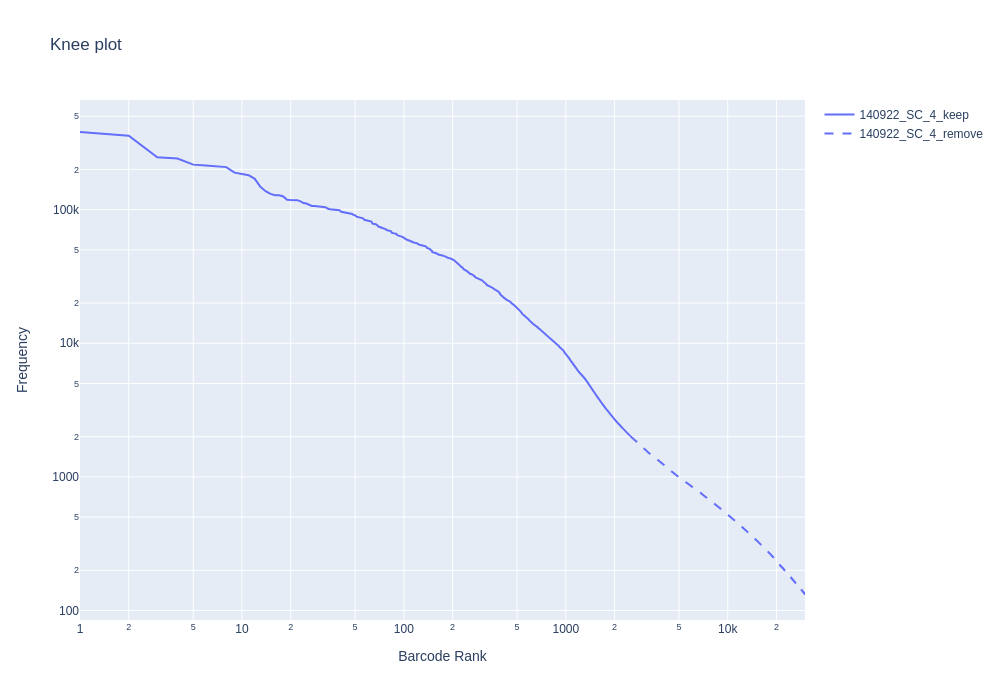
Knee plot
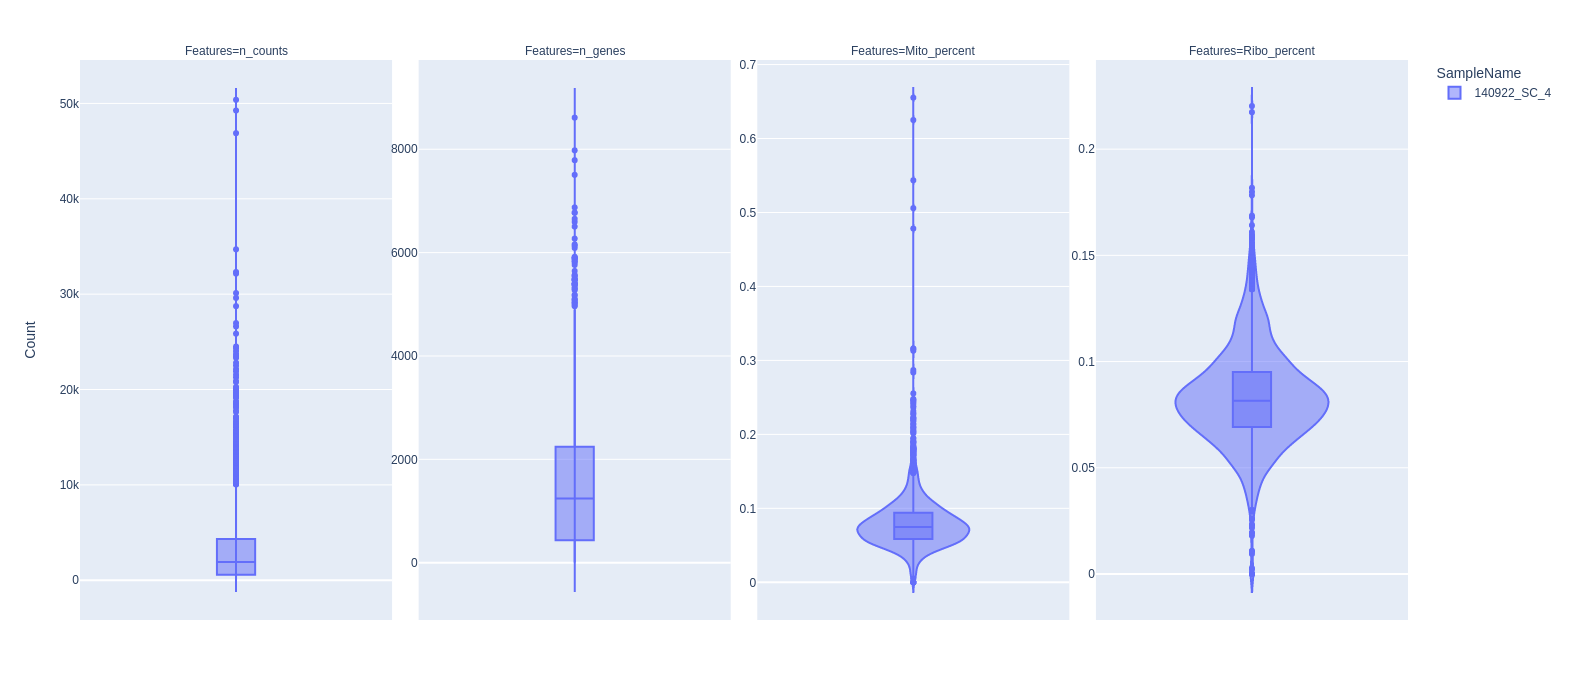
Violin plot
To calculate percentage of mitochondrial genes and ribosomal genes for each cell, we need to specify Regular Expression string for those gene symbol by –mito and –ribo options.
For example, mitochondrial genes in human and mouse usually have gene symbol
started with “mt-” or “MT-”. So, we use --mito "^MT-" (case sensitive is ignore).
Ribosomal genes usually start with “RPS” or “RPL”, so we use --ribo "^RP[SL]".
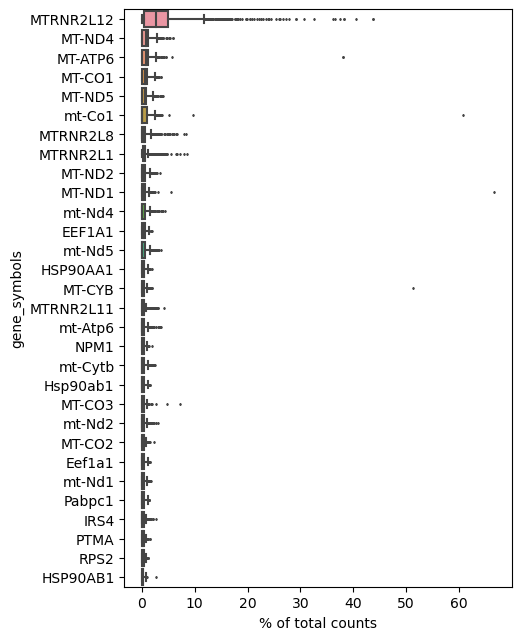
Highest Expressed Genes
Doublet rate plot
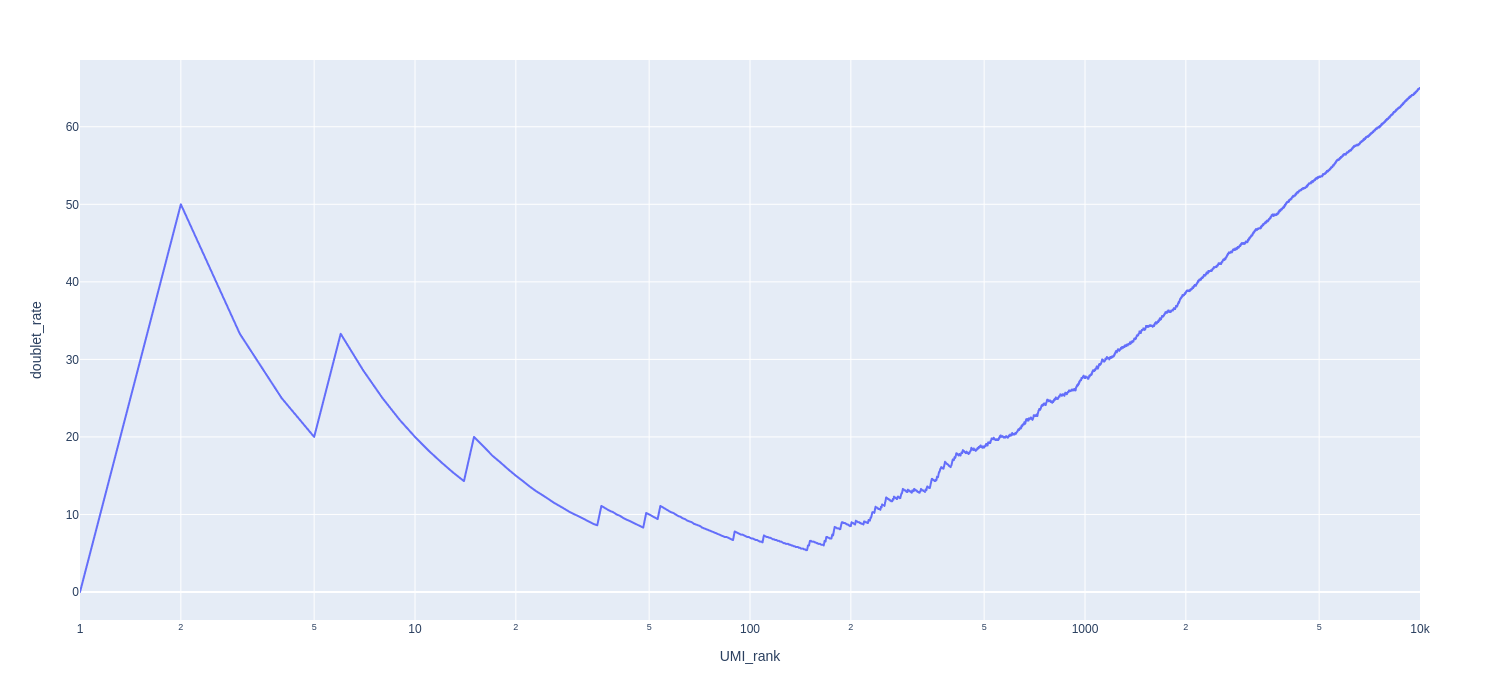
About the plot:
x axis: Barcodes ranked by UMI count (desending order)
y axis: the cumulative doublet rate. Doublet rate equals the number of mixed species barcodes divided by the total number of barcodes.
Barnyard plot
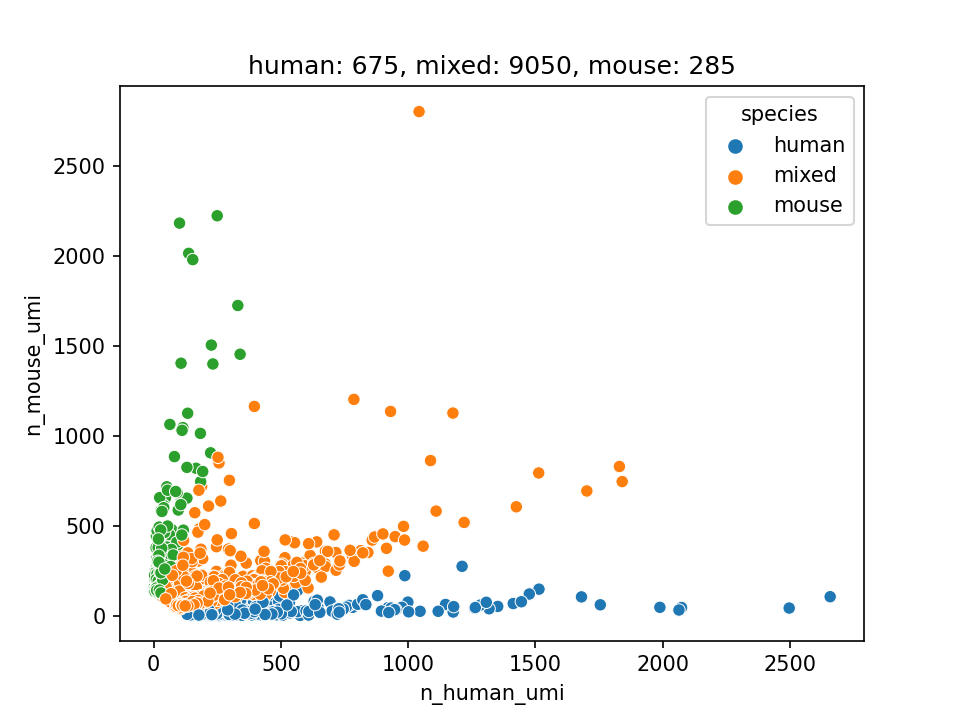
Note
This plot only contains filtered barcodes
Usage examples
STARsolo pipeline, single-cell workflow, RNAdia structure, filter top 100 cells mito, ribo genes, mixed species plots
nadia-quant \
    -r1 testdata/L1_R1.fastq.gz \
    -r2 testdata/L1_R2.fastq.gz \
    -i testresult/star_index \
    -o testresult/quant_star \
    -w single-cell \
    -a starsolo \
    -s RNAdia \
    --top-cells 100 \
    --mito "^MT-" --ribo "^RP[SL]" \
    --mixed-species
Alevin-fry pipeline, single-nucleus workflow, Drop-Seq structure, knee distance method mito, ribo genes
nadia-quant \
    -r1 testdata/L1_R1.fastq.gz \
    -r2 testdata/L1_R2.fastq.gz \
    -i testresult/salmon_index \
    -o testresult/quant_alevinfry \
    -w single-nucleus \
    -a alevin-fry \
    -s Drop-Seq \
    --knee
Argument details
Input output options
-r1, --read1
Required
Read 1 fastq file
-r2, --read2
Required
Read 2 fastq file
-i, --index
Required
Path to index folder
-o, --outdir
Required
Output directory
-n, --name
Sample name. It will be used for naming output files.
If not specified, then filename of read 2 will be used for sample name.
Alevin-fry options
--t2g
Path to transcript_to_gene file
--id2name
Path to gene_id_to_name.tsv
-m, --mode
Options: selective, pseudo
Align mode: selective align or pseudo align
Pipeline options
-w, --workflow
Required Options: single-cell, single-nucleus
Workflow: single cell or single nucleus
-a, --aligner
Required Options: starsolo, alevin-fry
Aligner: starsolo or alevin-fry
-s, --structure
Required Options: RNAdia, Drop-Seq
Barcode structure. See 3. Barcode structures
Filter options
--raw
Skip cell filter step, output raw matrix. For alevin-fry, --raw equal
--top-cells 5000000
--top-cells
See Top cells
--expect-cells
See Expected cells
--emptydrops-cr
--knee
See Knee distance
QC options
--mito
Default: “^MT-” Regular Expression string of mitochondrial genes
--ribo
Default: “^RP[SL]” Regular Expression string of ribosomal genes
Mixed species options
--mixed-species
Default: False
If this flag is used, output doublet rate and barnyard plot for mixed human and mouse sample.
--ratio
Default: 0.8
The threshold to classify human and mouse.