nadia-combine
Overview
Combine multiple single cell RNA-seq datasets.
- From Orchestrating Single-Cell Analysis with Bioconductor book:
Large single-cell RNA sequencing (scRNA-seq) projects usually need to generate data across multiple batches/datasets due to logistical constraints. However, the processing of different batches is often subject to uncontrollable differences, e.g., changes in operator, differences in reagent quality. This results in systematic differences in the observed expression in cells from different batches, which we refer to as “batch effects”. Batch effects are problematic as they can be major drivers of heterogeneity in the data, masking the relevant biological differences and complicating interpretation of the results.
nadia-combine takes processed AnnData object (h5ad file), integrates and
corrects for batch effects across multiple datasets. It provides two methods
for data integration: harmony and scanorama.
Learn more about Data Integration, see this tutorial.
How it works
1. Detect variable genes
First, all anndata objects are concatenated into single object. The matrix in processed AnnData object stores logtransformed normalized counts, so we can use it directly to detect variable genes, and then perform PCA.
# compute variable genes
sc.pp.highly_variable_genes(adata, min_mean=0.0125, max_mean=3, min_disp=0.5)

# subset for variable genes in the dataset
adata = adata[:, adata.var['highly_variable']]

# scale data, clip values exceeding standard deviation 10.
sc.pp.scale(adata, max_value=10)

# PCA
sc.tl.pca(adata, svd_solver='arpack')
2. Data integration
Users can choose the integration method by -m, –method option.
# harmony
sce.pp.harmony_integrate(adata, 'sample')

# scanorama
sce.pp.scanorama_integrate(adata, 'sample')
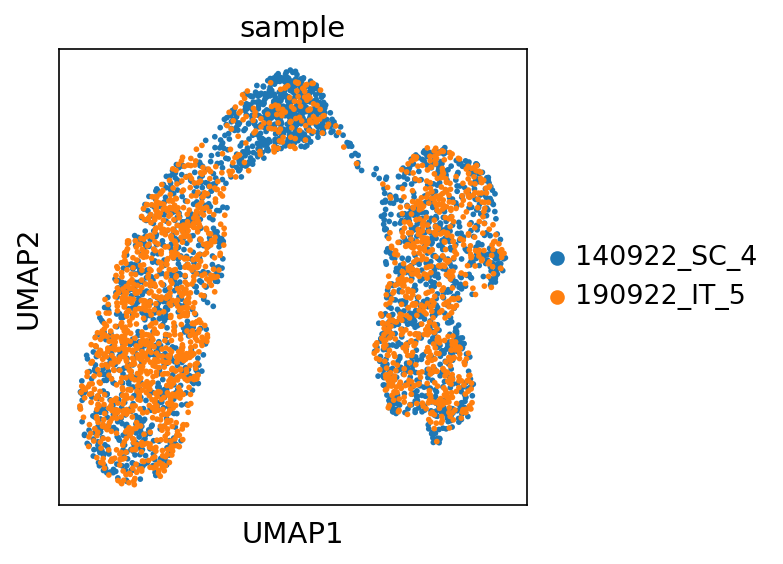
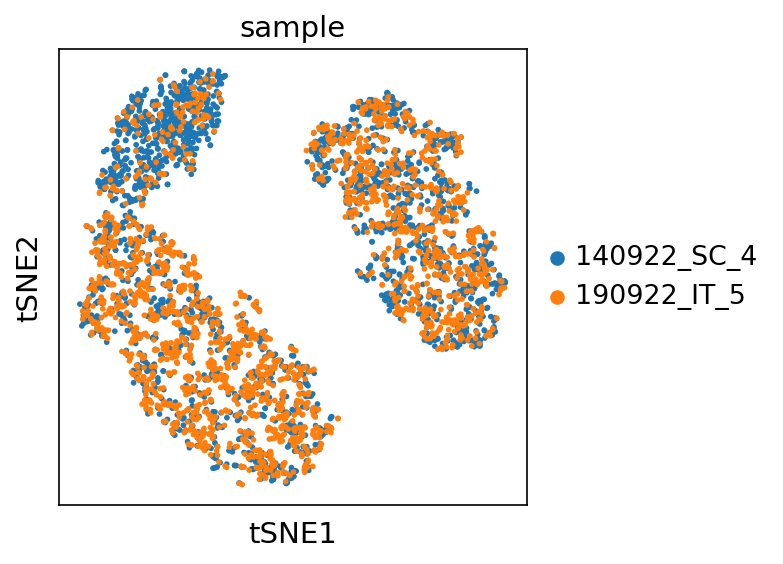
After that, UMAP and T-SNE embeddings are built. We create UMAP and T-SNE plots with cell are color by sample, as well as violin plot of metadata by sample.
Input
Processed AnnData object (h5ad file) from nadia-process.
Output
Integrated AnnData object
Integrated AnnData object (allsample.h5ad), which could be used in cellxgene -
visualization tool.
Report
nadia-combine produces a multiqc report in html format. You can download an
example report
Plots
UMAP plot by sample
T-SNE plot by sample
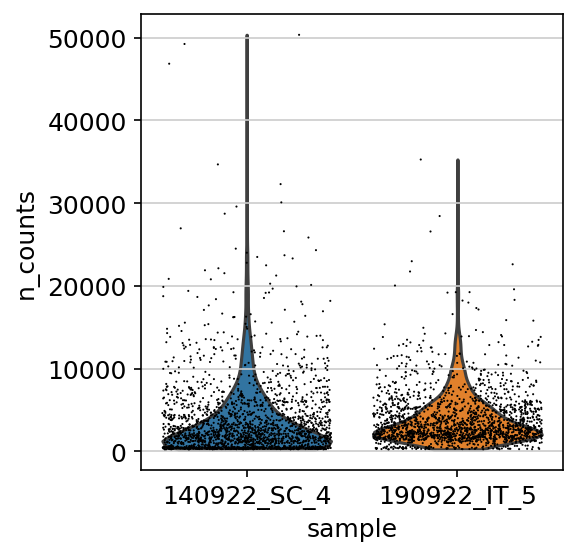
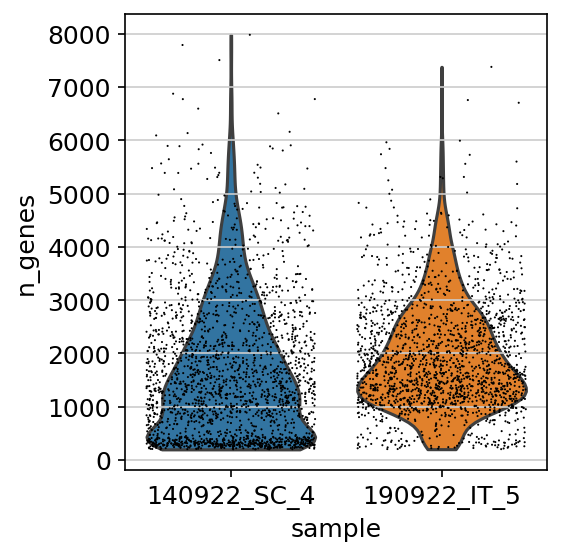
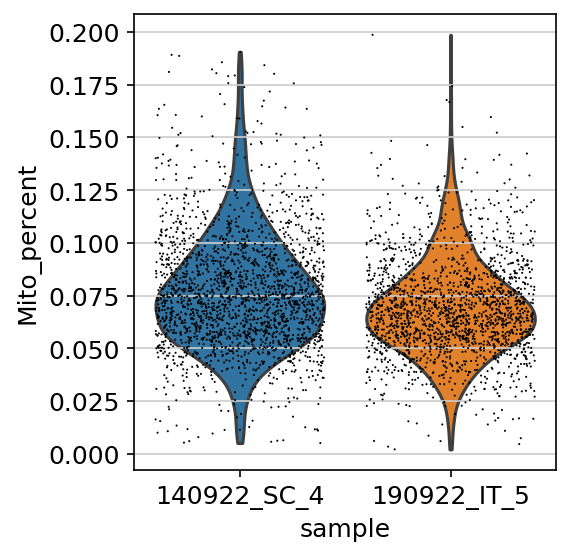
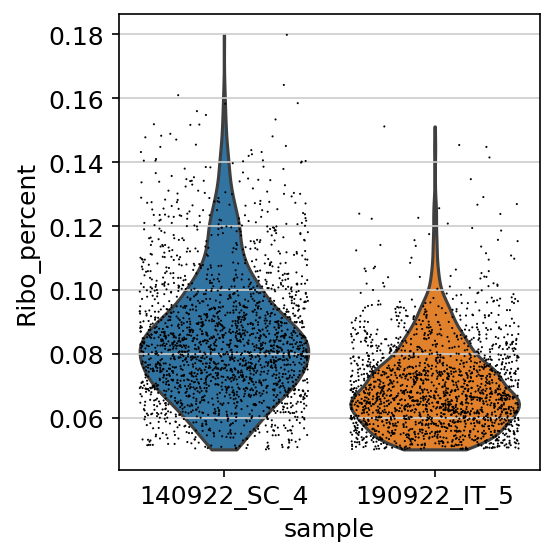
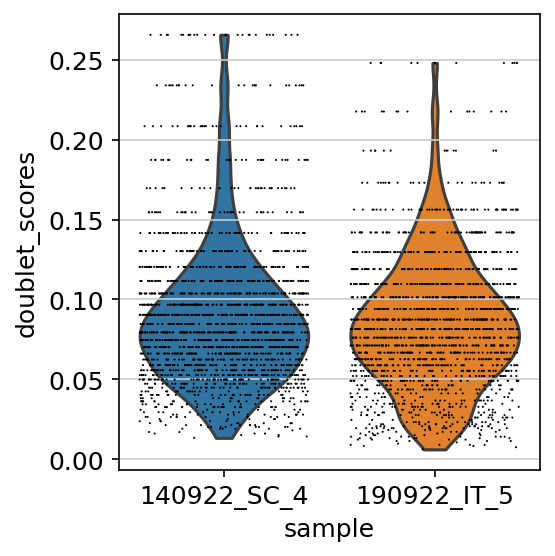
Violin plots of metadata by sample
UMI count
Gene count
Mitochondrial genes percentage
Ribosomal genes percentage
Doublet score
Usage examples
nadia-combine \
    --h5ad processed_anndata/*_processed.h5ad \
    -o nadia-combine \
    -m harmony \
    --n-pcs 10
Argument details
Input/Output options
--h5ad
Required
Path to processed h5ad file (AnnData object)
-o, --outdir
Required
Output directory
Integrate options:
-m, --method
Choices: harmony, scanorama, None
Integration method. If None, then do not perform data intergration.
--n-pcs
Default: 30
Number of Principle Components to compute UMAP and tSNE.
--n-neighbors
Default: 20
Number of neighbors to compute UMAP.